Author: Łukasz Grabowski
In the dynamic landscape of Business Central reporting, a significant transformation is underway, and it’s not just about adapting to new tools but necessitates a fundamental shift in the mindset of developers, consultants, and users alike. The days of building traditional reports primarily designed for paper or PDF consumption are evolving, making room for a new era of online analytics using Power BI, Excel layouts, and in-client data analysis.
Recognizing the sweeping changes, concerted efforts have been made to prepare the Business Central community for this shift. The recent Directions EMEA Lyon conference was marked by a focus on reporting and data analysis sessions, reflecting the urgency of understanding trends in the field.
The primary catalyst for this shift lies in the changing expectations of users. While traditional reports may have sufficed in the past, modern users are increasingly inclined towards dynamic and interactive analytics. Thus, the question “Can you build me a report?” no longer prompts a straightforward inquiry about formatting preferences. Instead, the new response is a pivotal shift in conversation:
As Kennie Nybo Pontoppidan from Microsoft suggests:
STOP asking: “Sure. How should it be formatted?”
INSTEAD ask: “What do you need to analyze and for what?”
This change in approach opens the door to a more strategic decision-making process. By understanding the analytical needs of the user, developers and consultants can then select the most appropriate tool for the task at hand.
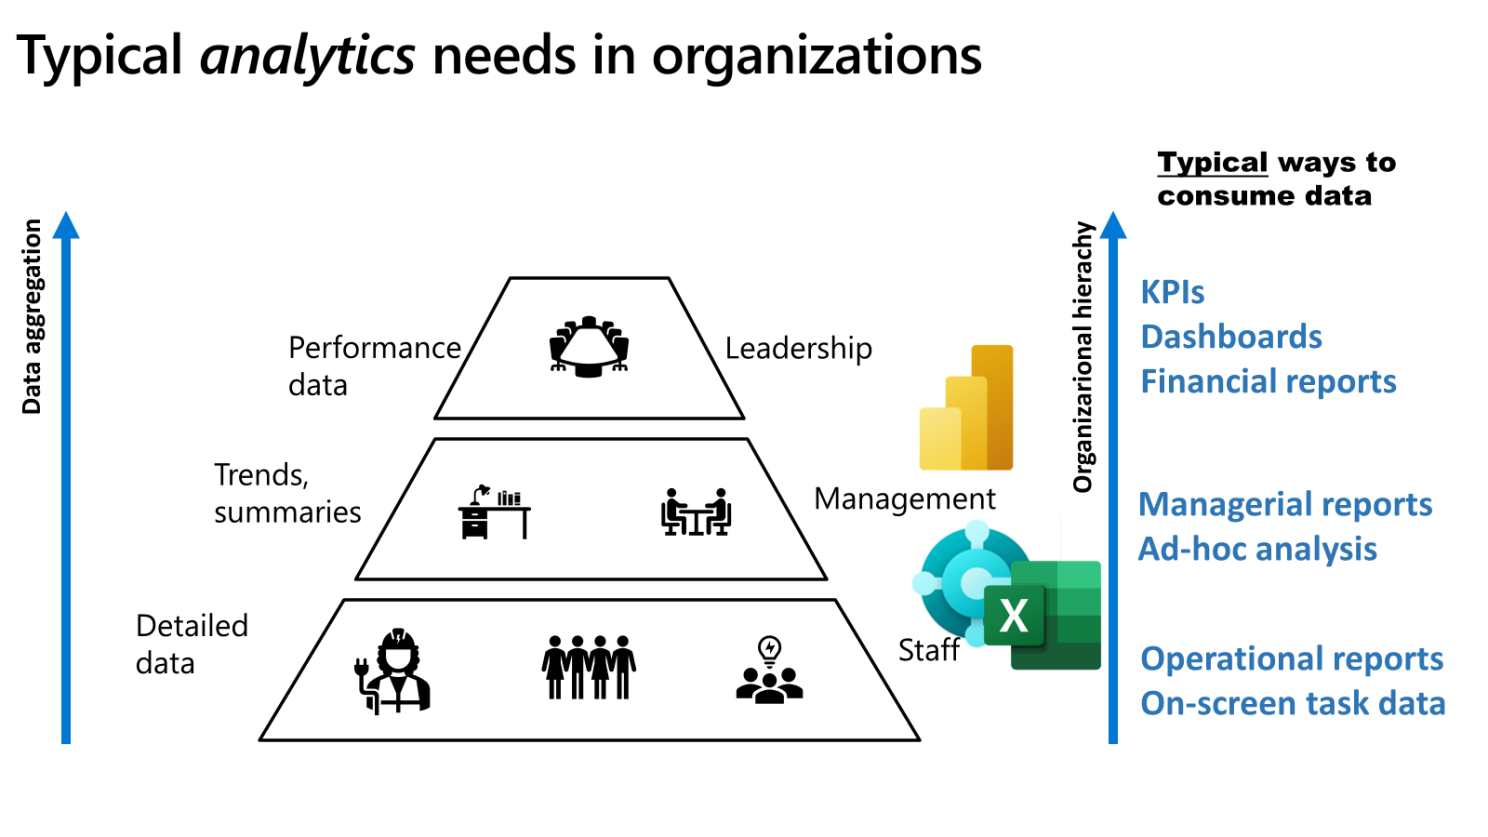
Three primary options stand out:
- Power BI – offering robust capabilities for visualizations, Power BI is well-suited for users who require dynamic and interactive dashboards. Its integration capabilities ensure seamless embedding within Business Central.
- Query/List page with Data Analysis – for scenarios where a more structured approach to data analysis is needed, utilizing the Query/List page with integrated data analysis tools becomes an optimal choice. This allows for a more focused examination of specific data sets.
- AL report with Excel layout – a classic option, AL reports with Excel layouts remain relevant, especially when users prefer the familiarity and flexibility of Excel for their analytical tasks.
Source: https://www.linkedin.com/newsletters/kennie-on-business-central-6981923051273658368/
Business Central professionals are encouraged to leverage these resources to not only stay updated but also to gain the necessary background knowledge to navigate the evolving reporting landscape. Understanding that there isn’t always a straightforward, one-size-fits-all approach is crucial. Directly opting for Power BI or Excel may not be the most effective solution in every scenario; a nuanced perspective is required. In each project, a blend of tools is often necessary, particularly when in-depth analyses are paramount.
An intriguing observation is the evolving landscape facilitated by Microsoft’s continuous upgrades to Business Central. Traditionally popular tools like Jet Reports or Jet Professional, once necessary in our projects, are now receiving less consideration. This shift is increased by the seamless data integration provided by Microsoft, allowing us to view data directly in Excel through Edit in Excel functions in BC.
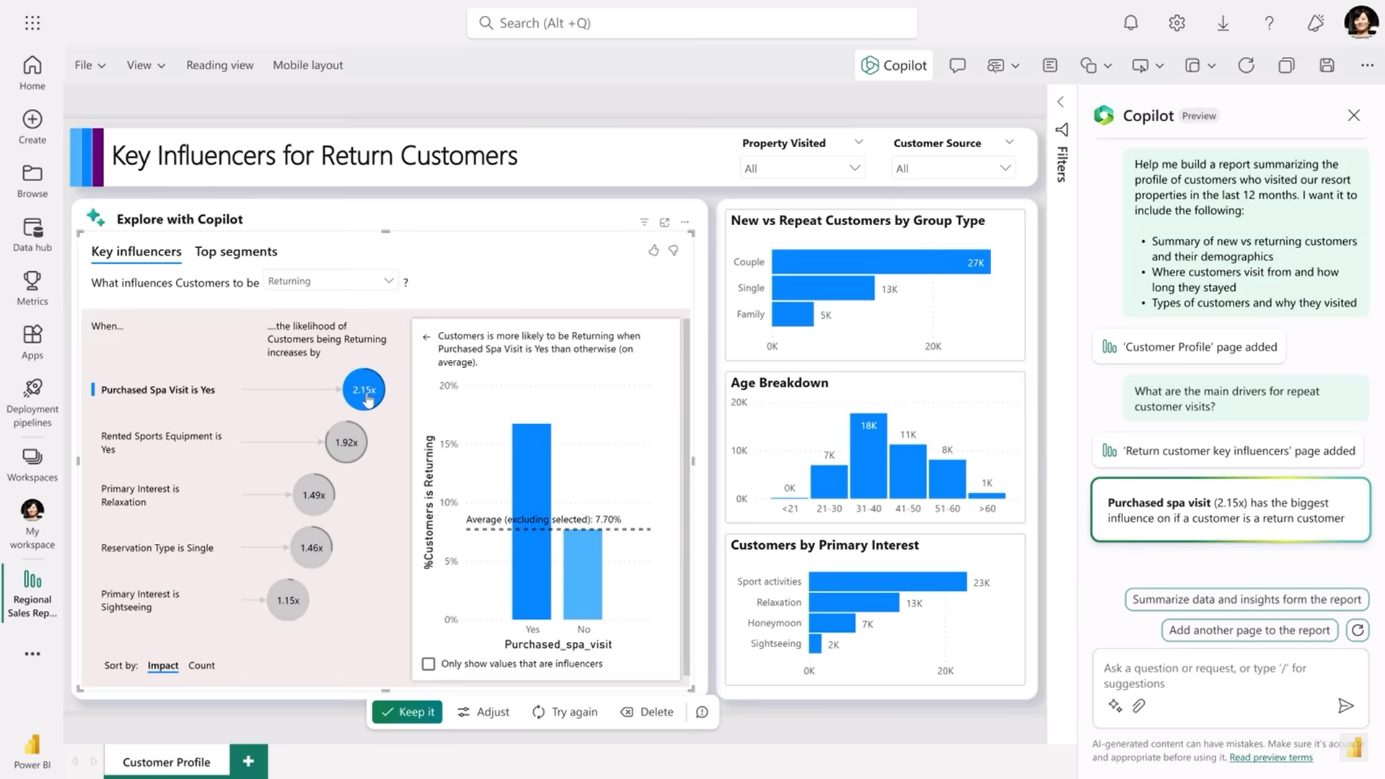
Adding to this transformation, the arrival of Copilot to Power BI introduces an exciting dimension. Envisioning the future, the streamlined connection between Power BI and Business Central suggests that delivering reporting solutions through Power BI will become even more compelling. Decision-makers are likely to find it easier to opt for BI, to use its full capabilities and seamless integration with Business Central. The trend indicates a promising evolution in the realm of reporting solutions, with Power BI faster to implement and easier to adapt.