Power BI is an elegant and powerful analytical tool created by Microsoft. Check out it’s great capabilities in our DEMO environment. Read more on our blog…
For a company to be successful and competitive in a changing economy it is critical to properly gather, process, analyze and interpret the data. One of the numerous advantages of Microsoft Dynamics NAV system is the possibility to create a database which combines all information generated within a company. Nevertheless, the efficient process of data consolidation requires the implementation of tools used to conduct quick processes of analysis and reporting. And here is where Power BI a new solution from Microsoft comes handy.
Power BI is a combines and improves four applications provided within the scope of Excel BI , that is Power View, PowerPivot, Power Query and Power Map. This tool allows one to create a faster, more effective and understandable data visualization. The whole process takes place on powerbi.com website, or with the use of PowerBI desktop application that you may install on your computer. Creating a profile, one has an access to the workspace which is divided into three main areas:
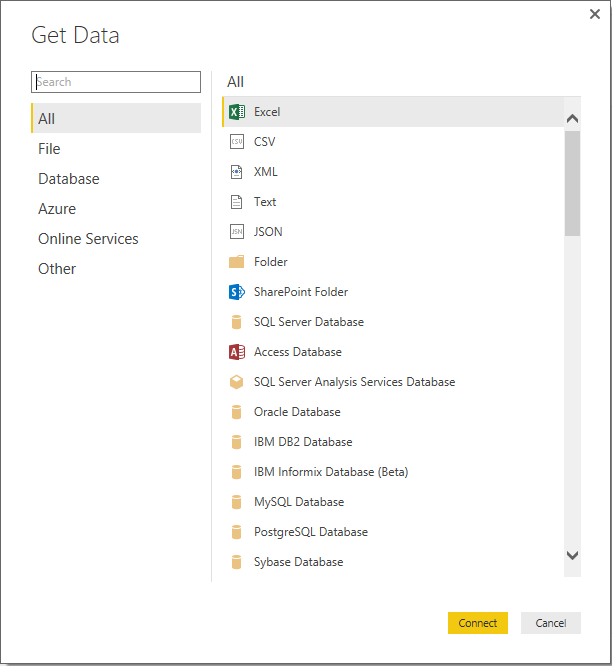
1. Data sets – XML, OData, SQL, Oracle, Web – these are only a few examples of data sets that may supply our workspace. What appears to be particularly useful in many cases is the possibility of including the records of Dynamics NAV and Excel spreadsheets in one database. One can link all sources using proper mutual relations, or introduce specific calculations. Entering the data is possible both on the powerbi.com website and through the PowerBI Desktop application:
2. Reports – a very quick way to visualize properly selected figures from the already prepared data sets (they may be published on a website)/
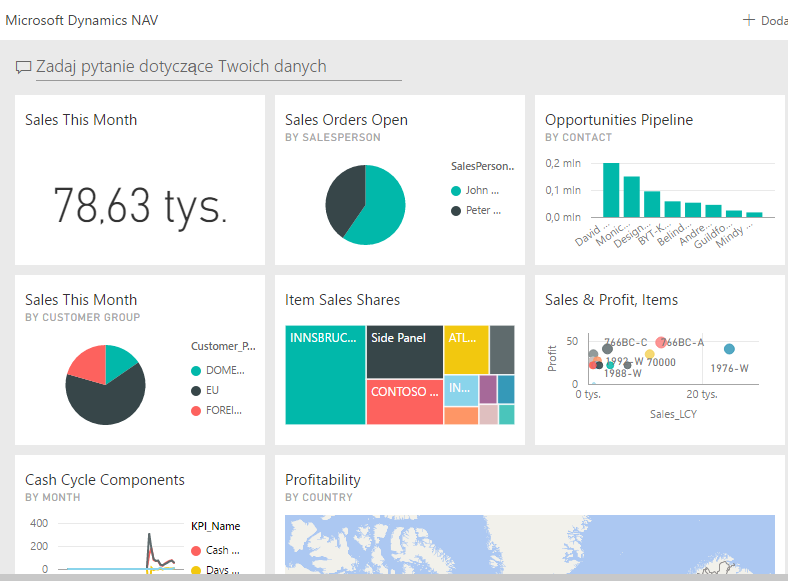
3. Dashboards – consist of properly selected reports, measures and external plugs (including the possibility of adding external spreadsheets). Thanks to correctly designed dashboards, the users are able to directly obtain a key group of information which support the decision making processes within a company.
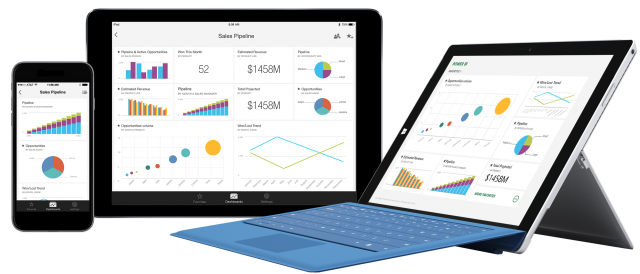
The integration of Microsoft Dynamics NAV with the Power BI service provides enormous potential for analysis. This solution results in a combination of predefined data sets and a quick access to conducting analyses. Furthermore, Power BI makes it possible to plan automatic processes of refreshing, which leads to reports being updated all the time. The users may create analytical models, freely modify the visualization, as well as share interactive presentations with other users. Additionally, with the service being provided online, one may use the reports through mobile devices. The access to data is becoming faster and more convenient.
The comfort and swiftness of using Power BI as well as its seamless integration with other Microsoft software make it a go-to solution for every company which thinks seriously about analyzing it’s data. We do this is why we started using Power BI several months ago and can share our findings with you during a DEMO session J It is worth mentioning that you can get Power BI for free for its basic version and for as little as $9,99/user per month when buying Power BI Pro version (allows for instance addition of multiple data sources).