Author: Ilona Juśkiewicz
Analyze, group, and pivot data on lists/queries
Now it is available self-service data analysis.
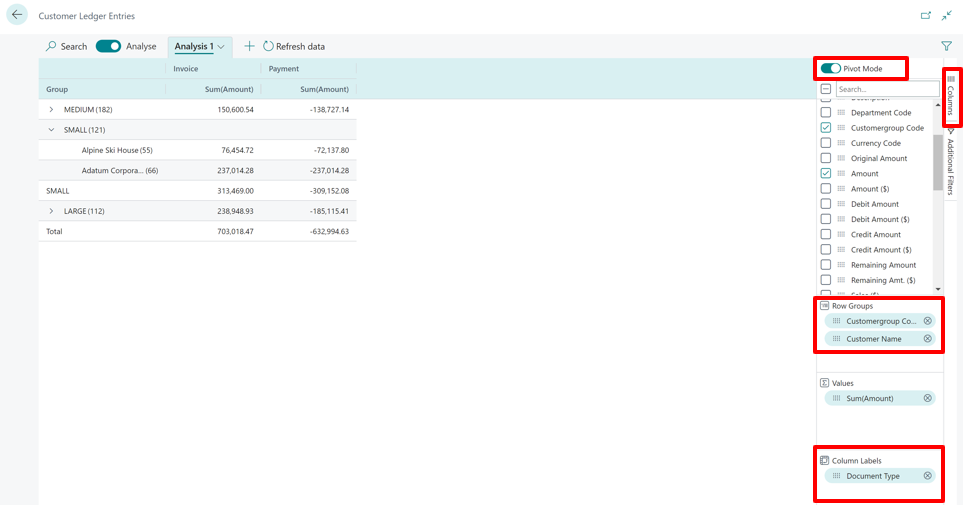
For each List page we can quickly extract insights from data directly in Business Central with no need to involve developers.
We have a lot of options, such as:
- Pick columns, reorder them, freeze left/right
- Set additional data filters
- Group and pivot
- Mark cells and do some quick fact checking
- Copy some/all data, import to Excel/PowerPoint/…

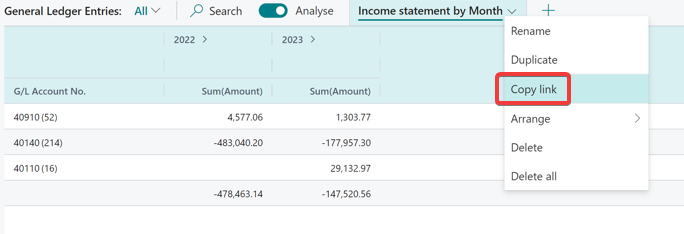
Such prepared analysis can be also saved for repetitive use or shared with our coworkers by copying link to that.

Improvements to Excel layouts
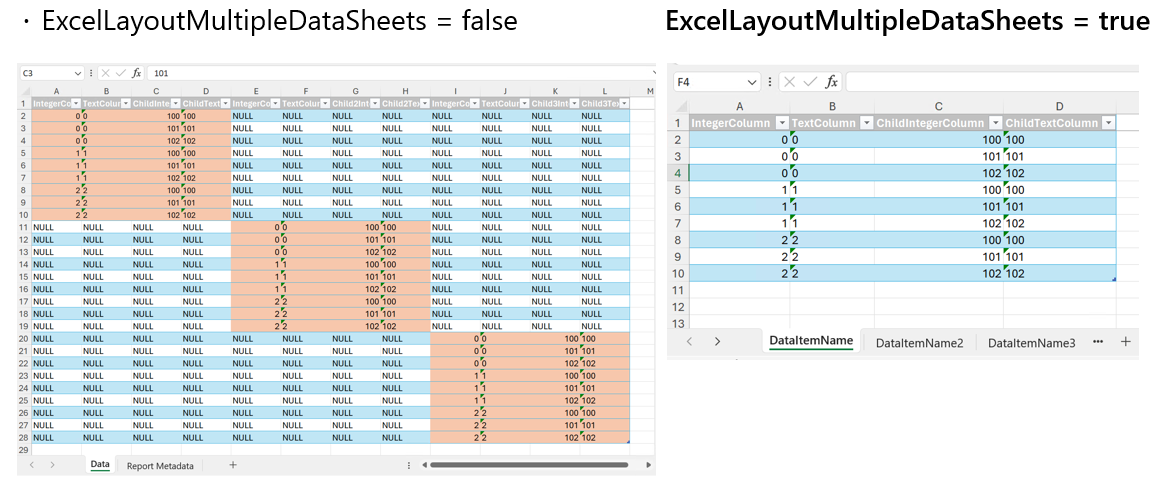
- Multi-sheet layouts – report datasets can be designed in a way that enables a very rich way to model things further in PowerPivot.

- Static runtime metadata worksheet – Always have a (hidden) worksheet with Report AL metadata, Report captions, Request page metadata, Request page filter data
- Support for translatability – report author can use tags for: Worksheets, Chart headers, Pivot elements. Server will replace tags at runtime when rendering the report.
New Power BI embed experience for user
- user choices are remembered
- support for Power BI metrics scorecards
- reports with multiple pages render as tabs
New capabilities for AL developers to control embedded Power BI
- Report opens in expanded mode.
- User cannot change a report or report page.